Prometheus ist ein äußerst beliebtes Monitoring- und Alarmierungssystem für vielerlei Einsatzbereiche. Von Datenbanken und Webserver bis zu Netzwerkkomponenten lässt Prometheus kaum Wünsche übrig und erfüllt mehr als zuverlässig seinen Zweck. Ursprünglich wurde es, gemäß der Dokumentation, unter SoundCloud, dem Online-Musik-Dienst, entwickelt. Nach der Trennung 2012 haben viele Unternehmen das Projekt adaptiert und weiter eingesetzt, sodass sich daraus eine äußerst aktive Community um das Projekt gebildet hat. Heute möchte ich dir zeigen, wie du Prometheus und Grafana unter Ubuntu installierst. Grafana ist ein Dashboard, in das man viele verschiedene Quellen einbinden kann. Darunter auch Prometheus. So kannst du mittels Grafana Abfragen bzw. Daten visualisieren, die durch Prometheus bereitgestellt werden.
Attention: For the english version, click here!
Vorbereitungen
Bevor du neue Software installierst, solltest du wie immer dein lokales Repository aktualiseren. Auch ein Upgrade der bereits installierten Pakete kann an der Stelle nicht schaden, um so später keine Schwierigkeiten zu haben, was veraltete Pakete angeht.
Hier bin ich schon im root-Kontext unterwegs. So kann ich mir das ständige sudo ersparen.
apt update && apt upgrade -yPrometheus installieren
Die Installation ist, abseits der vielen Tutorials im Internet mittlerweile wirklich leicht und kurz gehalten. Während viele noch einen User prometheus anlegen und den Systemd konfigurieren müssen, wird das alles mittlerweile bei der Installation über aptitude automatisch erledigt.
apt install prometheusNach ungefähr 280MB hast du den ersten Teil erledigt. Über systemctl kannst du jetzt prüfen, ob der Service aktiv ist.
systemctl status prometheusWenn alles planmäßig funktioniert hat, solltest du folgenden Output erhalten:
root@byte-sized.de:/etc/prometheus# systemctl status prometheus
● prometheus.service - Monitoring system and time series database
     Loaded: loaded (/lib/systemd/system/prometheus.service; enabled; vendor preset: enabled)
     Active: active (running) since Thu 2023-10-05 15:44:40 CEST; 1h 2min ago
       Docs: https://prometheus.io/docs/introduction/overview/
             man:prometheus(1)
   Main PID: 8496 (prometheus)
      Tasks: 10 (limit: 18935)
     Memory: 45.8M
        CPU: 10.429s
     CGroup: /system.slice/prometheus.service
             └─8496 /usr/bin/prometheus
Das sieht doch schon mal gut aus!
Starte deinen Webbrowser und öffne die Web-Oberfläche von Prometheus. Gebe dafür http://localhost:9090 in die Adresszeile ein
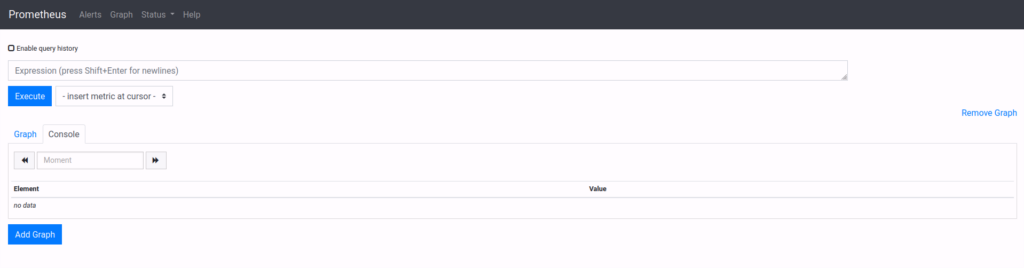
Natürlich schadet es nicht, wenn du dich erstmal genauer umschaust und dich mit der Oberfläche vertraut machst.
Falls du nicht auf die Weboberfläche kommst, kann es vermutlich an deiner Firewall liegen. Mit folgendem Befehl sollte das Problem dann auch behoben sein:
sudo ufw allow 9090/tcpInstallation von Grafana
Um Grafana zu installieren, solltest du als erstes den GPG-Schlüssel importieren – Du solltest nach wie vor im root-Kontext arbeiten.
mkdir -p /etc/apt/keyrings/
wget -q -O - https://apt.grafana.com/gpg.key | gpg --dearmor | sudo tee /etc/apt/keyrings/grafana.gpg > /dev/null
Als nächstes fügst du das stable Repository hinzu:
echo "deb [signed-by=/etc/apt/keyrings/grafana.gpg] https://apt.grafana.com stable main" | sudo tee -a /etc/apt/sources.list.d/grafana.listFalls du damit bisher Probleme hattest, folge den Schritten hier!
Update nun nochmals dein Repository.
apt updateSobald die Paketquellen aktualisiert wurden, darunter nun auch das stable-Release von Grafana, kannst du es nun endlich installieren.
apt install grafanaIst die Installation abgeschlossen, kannst du Grafana mittels systemctl starten:
systemctl start grafanaOb der Dienst wirklich läuft, überprüfst du wieder mit:
systemctl status grafanaSieht dein Output wie folgt aus, ist auch an der Stelle alles gut gelaufen und du hast Grafana erfolgreich installiert.
root@byte-sized.de:/etc/prometheus# /bin/systemctl status grafana-server
● grafana-server.service - Grafana instance
     Loaded: loaded (/lib/systemd/system/grafana-server.service; disabled; vendor preset: enabled)
     Active: active (running) since Thu 2023-10-05 16:25:50 CEST; 39min ago
       Docs: http://docs.grafana.org
   Main PID: 17648 (grafana)
      Tasks: 11 (limit: 18935)
     Memory: 74.0M
        CPU: 7.189s
     CGroup: /system.slice/grafana-server.service
             └─17648 /usr/share/grafana/bin/grafana server --config=/etc/grafana/grafana.ini --pidfile=/run/grafana/grafana-server.pid --packaging=deb cfg>
Hiermit verlassen wir die Konsole. Für den restlichen Teil des Tutorials benötigst du nur noch deinen Webbrowser.
Prometheus in Grafana einbinden
Die Weboberfläche von Grafana kannst du ganz einfach über http://localhost:3000 aufrufen. Dann solltest du das Anmeldefenster schon sehen können:

Der default-User lautet admin und das Passwort ebenfalls wieder admin. Danach wirst du auch direkt aufgefordert das Kennwort zu ändern.
Bist du erfolgreich eingeloggt siehst du auch schon, das noch sehr kahl wirkende, Grafana. Jetzt geht es darum Prometheus und die damit vorhandenen Datensätze entsprechend als Datenquelle zu Grafana hinzuzufügen. Dazu gehst du auf die drei Striche links in der Ecke und dann auf Connections. In dem neuen Untermenü gehst du wiederrum auf Data Sources.
Mittig deines Bildschirmes dürfte nun der große blaue Button Add Data Sources erscheinen. Diesen klickst du auch gleich an.

Direkt unter Time series databases an erster Stelle kannst du schon Prometheus auswählen. Dann musst du lediglich nur noch unter Prometheus server URL http://localhost:9090 eintragen, sofern du dem Tutorial gefolgt bist und kannst weiter unten mit Save & test bestätigen. Im Anschluss solltest du folgende Rückmeldung von Grafana erhalten:

Abschluss
Damit hast du erfolgreich Prometheus und Grafana installiert und Prometheus als Datenquelle in Grafana verfügbar gemacht. Jetzt kannst du die ersten Graphen und Dashboards bauen. Tutorials darüber werden auch noch folgen – Viel Spaß!
Installation of Prometheus and Grafana
Prometheus is an extremely popular monitoring and alerting system used in various applications. From databases and web servers to network components, Prometheus fulfills its purpose reliably and more. According to the documentation, it was originally developed at SoundCloud, the online music service. After their separation in 2012, many companies adopted and continued to use the project, leading to the formation of a highly active community around the project. Today, I want to show you how to install Prometheus and Grafana on Ubuntu. Grafana is a dashboard that can integrate various data sources, including Prometheus. This allows you to query and visualize data provided by Prometheus using Grafana.
Preparations
Before you install new software, as always, you should update your local repository. It’s also a good idea to upgrade the already installed packages to avoid issues with outdated packages later on.
I’m already working in the root context here, so I can avoid using sudo constantly.
apt update && apt upgrade -yInstalling Prometheus
Installation is now quite easy and straightforward, aside from the many tutorials available on the internet. While many used to create a user named prometheus and configure systemd manually, all of this is now handled automatically during installation via aptitude.
apt install prometheusAfter approximately 280MB, you’ve completed the first part. You can now check if the service is active using systemctl.
systemctl status prometheusIf everything has gone according to plan, you should see the following output:
root@byte-sized.de:/etc/prometheus# systemctl status prometheus
● prometheus.service - Monitoring system and time series database
     Loaded: loaded (/lib/systemd/system/prometheus.service; enabled; vendor preset: enabled)
     Active: active (running) since Thu 2023-10-05 15:44:40 CEST; 1h 2min ago
       Docs: https://prometheus.io/docs/introduction/overview/
             man:prometheus(1)
   Main PID: 8496 (prometheus)
      Tasks: 10 (limit: 18935)
     Memory: 45.8M
        CPU: 10.429s
     CGroup: /system.slice/prometheus.service
             └─8496 /usr/bin/prometheus
That looks good!
Start your web browser and open the Prometheus web interface. You can do this by entering http://localhost:9090 in the address bar.
Of course, it doesn’t hurt to take a closer look and familiarize yourself with the interface and the functions.
If you can’t access the web interface, it might be due to your firewall. You can likely resolve this issue with the following command:
sudo ufw allow 9090/tcpInstalling Grafana
To install Grafana, you should first import the GPG key. You should still be working in the root context.
mkdir -p /etc/apt/keyrings/
wget -q -O - https://apt.grafana.com/gpg.key | gpg --dearmor | sudo tee /etc/apt/keyrings/grafana.gpg > /dev/null
If you had any issues with these stept, follow this guide!
Next, add the stable repository:
echo "deb [signed-by=/etc/apt/keyrings/grafana.gpg] https://apt.grafana.com stable main" | sudo tee -a /etc/apt/sources.list.d/grafana.listNow, update your repository again.
apt updateOnce the package sources have been updated, including the stable release of Grafana, you can finally install it.
apt install grafanaWhen the installation is complete, you can start Grafana using systemctl:
systemctl start grafanaTo verify if the service is running, again check with:
systemctl status grafanaIf your output looks like this, everything has gone well, and you have successfully installed Grafana.
oot@byte-sized.de:/etc/prometheus# /bin/systemctl status grafana-server
● grafana-server.service - Grafana instance
     Loaded: loaded (/lib/systemd/system/grafana-server.service; disabled; vendor preset: enabled)
     Active: active (running) since Thu 2023-10-05 16:25:50 CEST; 39min ago
       Docs: http://docs.grafana.org
   Main PID: 17648 (grafana)
      Tasks: 11 (limit: 18935)
     Memory: 74.0M
        CPU: 7.189s
     CGroup: /system.slice/grafana-server.service
             └─17648 /usr/share/grafana/bin/grafana server --config=/etc/grafana/grafana.ini --pidfile=/run/grafana/grafana-server.pid --packaging=deb cfg>
Now, we’re leaving the console. For the remaining part of the tutorial, you will only need your web browser.
Integrating Prometheus into Grafana
You can easily access the Grafana web interface at http://localhost:3000. You should already see the login window:
The default user is „admin,“ and the password is also „admin„. After that, you will be prompted to change the password.
Once you have successfully logged in, you will see the somewhat empty Grafana interface. Now, the goal is to add Prometheus and its datasets as a data source in Grafana. To do this, click on the three lines in the corner, then select „Configuration„. In the new submenu, go to „Data Sources„.
In the middle of your screen, you should see a large blue button „Add Data Source„. Click on it.
Under „Time series databases„, you can select Prometheus as the first option. Then, all you need to do is enter http://localhost:9090 under „Prometheus server URL“ (assuming you followed the tutorial) and confirm with „Save & Test“ below. Afterwards, you should receive the following confirmation from Grafana:
Conclusion
You have successfully installed Prometheus and Grafana and made Prometheus available as a data source in Grafana. Now, you can start building your first graphs and dashboards. More tutorials on this topic will follow – Have fun!
Start the discussion